Imagine you are someone who has played with performance co-pilot and its web applications. You've grown beyond the default dashboards, and want something more.
You've come to the right place: the Custom Metrics Web Emporium!
step 0: log the metrics
Let's presume you already have basic PCP up and running on a Fedora/RHEL-like system. If you need a non-default PMDA, you may need to:
# yum install pcp-pmda-FOOBAR
# cd /var/lib/pcp/pmdas/FOOBAR
# ./Install < /dev/null
If the PMDA is self-configuring, that's enough to fetch live data from it. If you also want
the data archived, which you do, you may need to edit the appropriate pmlogger configuration.
You could run pmlogconf against a config.pmlogger file you're already using, or edit it,
assuming you know where to find it. If you're avant-garde enough to let pmmgr run your
logging, and you want it to simply work for your whole network dammit,
# cd /var/lib/pcp/config/pmlogconf
# cat > MY_FAIR_METRICS.conf
ident MY FAIR METRICS
probe FOOBAR.ONE exists ? include : exclude
      FOOBAR.ONE
      FOOBAR.TWO
      FOOBAR.THREE
^D
# /sbin/service pmmgr restart
The FOOBAR.ONE metric is any metric you know is contained in the PMDA, if it's working
correctly; the other FOOBAR.* ones are metrics or whole hierarchy prefixes of metrics
that you want future pmloggers to archive. You can confirm that any new archives get
the FOOBAR metrics stored in them via pmdumplog /var/log/pcp/.../archive*.meta,
or by looking at the pmlogger.log files.
If you agree that this is rather too many steps, consider adding your voice to this enhancement request.
step 2: find the metrics in graphite
Once your fancy new metrics start being logged to a file, it's time to check them out on
the web. You'll need to run a pmwebd server and have its pcp-webapps package(s)
installed, so that its web page http://localhost:44323/ pops up.
Then comes finding the metrics. Since there are approximately one gazillion of them, and
possibly stored over one mazillion separate pcp archive files, pmwebd needs a notation
to identify the one(s) of interest. It does this via the graphite webapi subset
it implements. The gist of it is that metrics get named something like archive.met.ric, where the
first component identifies the archive file or host name, the middle components identify the
pcp metric names, and the optional last component identifies the instance within that metric.
It's harder to explain than to show, so go and hit the graphite top level link.

Hit the little plus sign beside the "Graphite" folder, wait for the first level (archive-file/host-name) of the metric hierarchy to be populated. Find the most recent archive for your host, and keep clickin on the little pluses until you get to a real live FOOBAR metric.
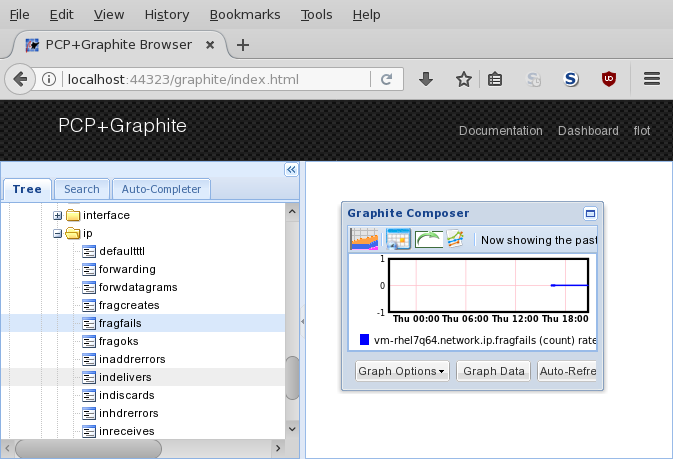
If you click on the "Graph Data" button in the little composer/graph
subwindow, you will see the full graphite name for your FOOBAR metric.
Note it down. The you will probably want to replace the first component
with one with a wildcard such as *HOSTNAME*, in order to let pmwebd
search for all archives for the same host. You may want to replace the
last component with * too, if it's a metric with an instance domain,
in order to draw all instances.
If you click on the graph image itself, and get your web browser to spit out its URL, you will see something like
http://localhost:44323/graphite/render/?width=249&height=98&_salt=1497559426.608&target=vm-rhel7q64.network.ip.fragfails
If you play around with the time interval buttons at the top of the subwindow, extra fields will appear in the URL querystring:
?from=1497473484&until=1497559884
to specify the time interval. In this example, these are UNIX-style
epoch-seconds, but other syntaxes such as -2day for "two days ago"
or now for now, or HH:MM_YYYYMMDD for, well, it's obvious. All
times/dates are interpreted in UTC.
Other parameters are available to specify rendering parameters like colors, to add or subtract a legend, add other metrics. Experiment with the graphite compose window's interactive options to see their behaviour.
step 3: construct dashboard
OK, now that you have a URL for an image, you can keep it, pass it around. But that's not good enough, is it? Otherwise you wouldn't still be reading this.
But you are. So let's get to making a dashboard. There are at least two basic
approaches: roll-your-own HTML, or grafana. In the roll-your-own HTML case,
you already have everything you need: make an HTML file with a set of IMG tags,
with each SRC pointing to one of the above graphite image URLs. Format it as
you like, publish it, done!
Grafana is another way. This is another webapp we bundle with pcp, and it is oriented toward building sets of related graphs. Normal grafana includes a dashboard storage/management server, which pcp's version doesn't, so we have to work a little harder. See this blog post for details about how the grafana dashboards may be constructed as explicit JSON files, or synthesized on the fly from a URL that includes metric/host names as querystring elements. Just use the compound graphite metric names you found for your FOOBAR metrics. Add any others of interest. Use wildcards liberally.
step 4: profit!
(warning - results not guaranteed)