One of my day jobs is working on Performance Co-Pilot (PCP), a free-software package for monitoring computers/networks. It has some neat capabilities of its own, but one of the best parts is the ease of covering up the capabilities it lacks. In particular, when another package has something we need, we can usually interface to it and offer users the best of both worlds.
On today's menu is interfacing to the Graphite package, which has a certain cachet for nice interactive web-based charting and a clever data storage scheme, all done in Python. PCP has native charting tools too, but nothing as good & pretty for the web as Graphite.
Can the two talk together? As of today, heck yes. At least, in a git branch, there is a little python script pcp-graphite.py which feeds data from the PCP system into graphite. It allows the large numeric subset of PCP data to be easily browsed/manipulated with the Graphite toolset.
How does it look?
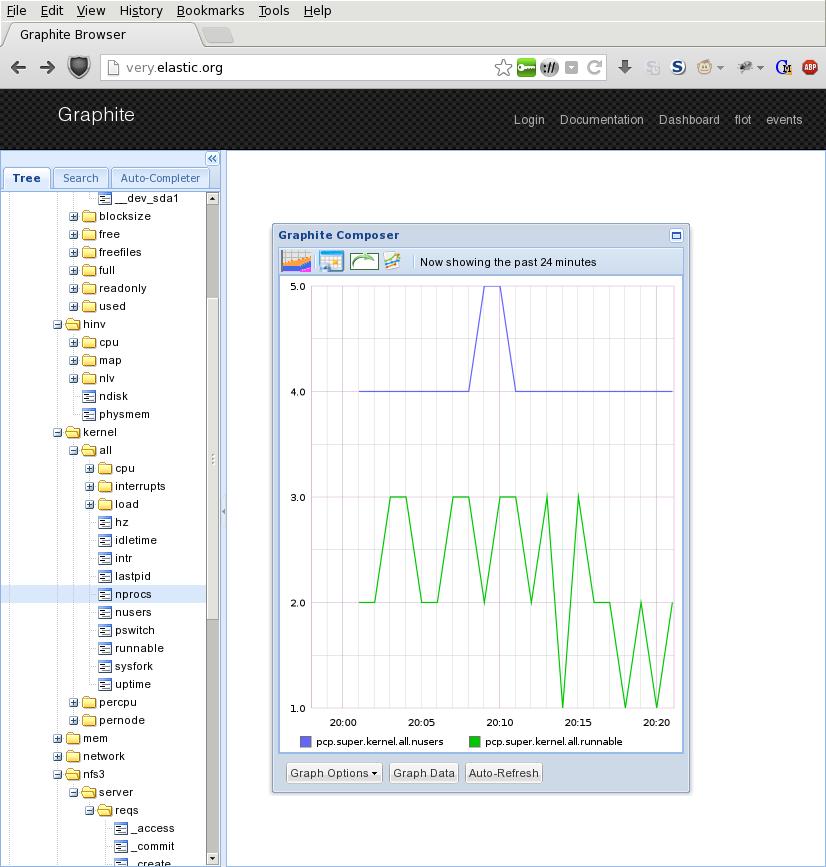
You're looking at a screenshot of the graphite web front-end on a Fedora 19 workstation. The picture is too small to contain the hundreds of PCP metrics being injected there (sorry).
How to try it? That's a bit complicated, since this is just an early development branch, but chances are that after installing the next PCP release (3.9.2, due this week), you'll be able to grab just the pcp-graphite.py script out of the repository and run it on top. Until then, if you're very keen, you could build a whole 3.9.2 pre-release snapshot out of the branch.
Oh, and you'll need Graphite etc. too. On Fedora, here are all the steps:
- Avail yourself of PCP 3.9.2 of some form.
# wait till release or build your own
# yum install pcp
# /sbin/service pmcd start
- Avail yourself of the pcp-graphite script.
- Avail yourself of graphite-web (season to taste):
# yum install graphite-web # cat >> /etc/httpd/conf.d/graphite-web.conf <Directory /usr/share/graphite> Options All AllowOverride All Require all granted </Directory> ^D # /sbin/service httpd start - Avail yourself of python-carbon:
# yum install python-carbon
# /sbin/service carbon-cache start
- Run pcp-graphite.py in the background to start feeding data.
% python pcp-graphite.py kernel mem network disk filesys
Relaying 451 metric(s) in pickled mode to localhost:2004 every 60.000 s
- Run a few more copies if pcp-graphite.py if you'd like to relay different data from other PCP server (-h HOST), at different intervals (-t SECONDS), to remote graphite/carbon servers (-g HOST), with a unique graphite metric prefix (-m FOO.HOST.). More options coming soon.
- Sic a web browser on the bad boy, and click around the metric tree.
% firefox //web.elastic.org/
- Find out more about the PCP metrics in question. Graphite's data model is too poor to tell you exactly what the numbers mean, but PCP will. (pcp-graphite will soon learn to rescale on demand.)
% pminfo -d -t kernel.all.runnable network.interface.speed mem.numa.util.dirty

kernel.all.runnable [total number of processes in the (per-CPU) run queues]
    Data Type: 32-bit unsigned int  InDom: PM_INDOM_NULL 0xffffffff
    Semantics: instant  Units: none

network.interface.speed [interface speed in megabytes per second]
    Data Type: float  InDom: 60.3 0xf000003
    Semantics: discrete  Units: Mbyte / sec

mem.numa.util.dirty [per-node dirty memory]
    Data Type: 64-bit unsigned int  InDom: 60.19 0xf000013
    Semantics: instant  Units: Kbyte
Note that this is all for passing data to Graphite; fetching it from its lovely embrace (so PCP tools can directly process it) is also possible, but would be a separate prototype. Please let us know if that capability would be of interest/use to you.
update pcp2graphite is included in pcp version 3.10.2