Let's follow up a previous prototype, turning that work upside down.
In our first visit to the fantasy land of PCP+Graphite, we created web renderings of PCP data by a small python script periodically polling PCP information, relaying it to the graphite carbon network-server/database, and letting the carbon server talk to the graphite web-app. It looked like this:
There are a lot of parts - at least three separate server processes between the web browser and the data. Each of those servers requires configuration, firewalling, and other such care & feeding. Each uses cpu/memory/disk and adds latency. This is probably fine if the graphite/carbon installation is already the centerpiece of one's monitoring installation, and PCP is only a subordinate data source.
But what if PCP is the data source, and we're just looking for a pretty web gui for it? This is not far-fetched - PCP can efficiently ingest data from many other systems (and expel it again in original form). Can we have a simpler installation?
Why, yes.
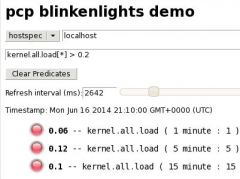
PCP's pmwebd server is a relatively recent addition to the toolset. Its original job has been to bridge the PCP client API to web applications through a JSON API. It included a little baby fileserver for hypothetical webapps to use that API, though we only included a toy set of blinkenlights.
The new and improved pmwebd over at this git branch has been learning one extra trick. It has learned to answer several of the graphite web-api protocol commands that the carbon & graphite server-side code normally answers, and maps them to queries against the underlying PCP dataset. No python, no carbon, no httpd.
How to run it? Build pmwebd from the src/pmwebapi directory, after running the top-level configure (so the cairo library dependencies are found). Then choose any directory containing PCP archives. (This can include nested subdirectories, as produced by the pmlogger_daily or pmmgr tools. Thanks to recent work by Ken McDonell, this can include archives being written-to at the same time, so close to "live" data.) Then run:
% ./pmwebd -G -R jsdemos -A /path/to/archives
	Started daemon on IPv4 TCP port 44323
	Using libmicrohttpd 0.9.33
	Serving non-pmwebapi URLs under directory /path/to/pcp/src/pmwebapi/jsdemos
	Remote context creation requests enabled
	Archive base directory: /path/to/archives
	Graphite API enabled with Cairo graphics
	Periodic client statistics dumped roughly every 300s
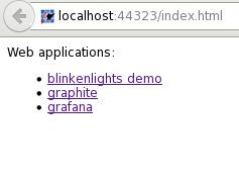
Then sic a web browser at http://localhost:44323/. That's it. You may run as many copies of pmwebd as you like, with different port numbers.
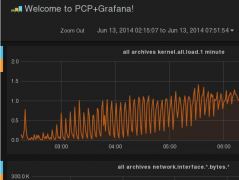
How does it look? Well, just like graphite, or grafana, a peer web gui that works on the same server interface. An unmodified release snapshot of each is included with pmwebd sources. Not every feature in the web apps is implemented yet or perfectly emulated, but the basics are there. One can zoom in/out, put together dashboards of info.
The pcp-to-graphite namespace mapping is straightforward: the top level graphite name identifies the individual archive file; middle levels identify the pcp metric; the last level (if appropriate) identifies the instance of the pcp metric. Only numeric types are currently supported; events should come at some point, as should connection to live PCP collector (pmcd) processes rather than just to archives.
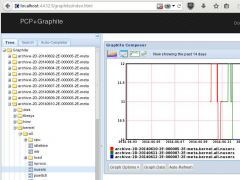
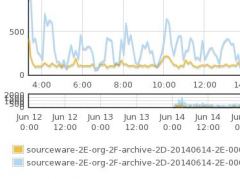
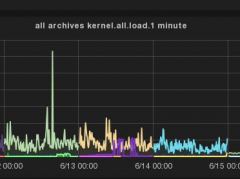
This last one, a zoomed-in view for your humble scribe's workstation, is displaying 100% genuine oscillations related to this PCP infrastructure bug in the process of affecting this very pmwebd. Spot the pigeon.
