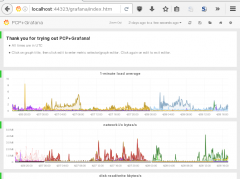
Our previous work gluing Performance Co-Pilot and Grafana together has made it possible to look at a networkful of systems' performance stats and histories with just a few clicks on a web browser, and no auxiliary software (databases, web servers, etc.) other than PCP itself.
Many people probably stopped at the most basic use of the technology: with the grafana dashboards provided.

Each graph draws a one or more time series specified by a graphite-syntax series, as outlined in the pmwebapi man page, as applied to the graphite specification. The gist is that each series is a dot-separated name consisting of an host/archive identifier followed by components to identify PCP metrics and their instances. Each component can be wildcarded.
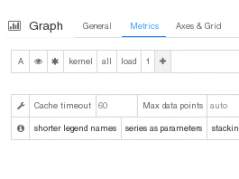
 In the grafana chart-editor window for the top default-dashboard chart, you can see that the series it draws is *.kernel.all.1 minute. This means that this series will expand to the kernel.all metric's 1 minute instance, within all archives for all hosts that cover the selected time interval. In plainer language, all machines' one-minute load average will be overlaid on this chart. Other charts on that dashboard are similarly wildcarded: one or more related metrics across all machines.
What about if one's interested in just one machine? While you can hunt & peck amongst the overlapping curves to find a particular machine of interest, this is obviously clumsy. You could pop open that dashboard editor in the web browser (by clicking on each chart title) and change the metrics to replace the first position (host/archive) from the general wildcard * with a more specific one such as *HOSTNAME*. (The * on both sides are still needed, because the host's data may be split across several physical archives, and may be stored in different physical parent directories.) While at it, you can change or add other PCP metrics. Then you can use the "save/download JSON" button to get a modified dashboard JSON file, and reload it later. That reloading can be done by interactively "load/import" button, or by depositing the JSON file under /usr/share/pcp/webapps/grafana/app/dashboards/FOO.json and directing one's browser to http://server:44323/grafana/index.html#/dashboard/file/FOO.json.
This works, and is a general and powerful technique, but is pretty clunky. Sorry about that.
Coming along with the next version of PCP is some new automation to help. It uses the grafana scripted dashboard mechanism. (Thanks to my colleague Zack Cerza for the pointer.) This is a way of having a javascript program generate a grafana dashboard on the fly. So, instead of hard-coded *.something, a program running in one's browser can synthesize something special. Perhaps interactively!
Presenting #/dashboard/script/multichart.js. This scripted dashboard populates one grafana dashboard, exclusively by reference to its invoking URL querystring. It builds one chart per each incoming &target=SOURCE parameter, with some optional formatting parameters. Since the dashboard is specified entirely from its querystring, it can be bookmarked in the browser. It can be shared with others by just copying the URL. It's much easier than exporting JSON and re-importing it again.
Some examples:
- http://server:44323/grafana/index.html#/dashboard/script/multichart.js?target=*.kernel.all.load.1%20minute
approximately matches the top chart of the classic default dashboard. - http://server:44323/grafana/index.html#/dashboard/script/multichart.js?target=*HOSTNAME*.kernel.all.load.1%20minute
the same - but restricted to HOSTNAME! - http://server:44323/grafana/index.html#/dashboard/script/multichart.js?target=*HOSTNAME*.kernel.all.load.1%20minute&target=*HOSTNAME*.proc.nprocs
same, adding a chart of the proc.nprocs metric. (Note repetition of the &target= parameter.) - http://server:44323/grafana/index.html#/dashboard/script/multichart.js?target=*FIRSTHOST*.kernel.all.nusers,*SECONDHOST*.kernel.all.nusers
two overlapping timelines of the same metric from two separate hosts. (Note comma separated series in the same &target= parameter.
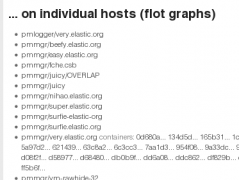
Presenting #/dashboard/script/hostselect.js. This scripted dashboard populates one grafana dashboard, but a special one that doesn't actually include any charts. Why is that? Simple. It's a host selector! It uses an internal query to pmwebd to generate a list of hosts for which it has archives. Then a user is shown a menu of them, and can click on any to take them to a multichart.js scripted dashboard tuned to that host. If you run pmmgr with its subtarget-containers flag turned on, the dashboard will list all per-container archives too.
Which metrics to show for the host? Those are specified by &metric=PCP.MET.RIC parameters to the hostselect.js dashboard; if none were given, the script gives a default set. It looks like this.
Each of the host names in the list at the bottom is a link you can click on. Well, I can, not you - that's just a screen shot after all. But once you install your copy of this fresh pcp-webjs stuff, you will get your own 100% PCP-powered, dynamically-generated host selector and URL-controlled multi-chart grafana dashboards. You can wait until the next PCP release, or can download all the PCP web applications straight onto your machine right now:# >>> uninstall pcp-webjs* if already present # cd /usr/share/pcp # mkdir webapps # cd webapps # git clone --depth 1 -b webjs git://sourceware.org/git/pcpfans.git . # >>> restart pmwebd service % firefox http://localhost:44323/
