In our two prior installments, we discussed two ways how Performance Co-Pilot can operate with graphite-flavoured web browser frontends. First, relaying pcp data to graphite, then using the graphite server + webapp. Second, accessing pcp archives in situ, using pmwebd-served webapps. Today we cover a third case.
This case comes about from recent updates to grafana, one of the webapps pcp already bundles. Grafana version 2 has moved to a model where it is no longer a pure webapp, and is said to require its own server process (written in Go) to serve the webapp to the browser, along with dashboarding/authentication metadata. It is not clear to your humble scribe how much value those latter bits bring to the table, but version 2 of the webapp does have some nice eye candy extensions.
The current experience with having grafana v1.9.1 served directly by pcp pmwebd is great. (Try it!) If only we could have the grafana v2 work the same way - without the new server ... but alas.
But until we figure that out, one can use the following scheme to run the grafana v2 webapp against pcp data.
The gist of it is to use the grafana v2 server only to serve the webapp and dashboard metadata, and defer to pcp pmwebd for actual data to draw.
To try it out:
- Install PCP and its webapps, collect some data perhaps with pmmgr, and start the pmwebd process too. Try out the bundled grafana v1.9.1 and pals http://localhost:44323/. If those are good enough, you can stop here and not worry about grafana v2.
- Acquire the grafana v2 code. One can download binaries or build from sources.
- Install the grafana v2 code somewhere.
% tar xfz grafana-2.1.3.linux-x64.tar.gz
- Run the grafana v2 server:
% cd grafana-2.1.3
% ./bin/grafana-server
[...]
[I] Listen: http://0.0.0.0:3000/
- Sic a web browser at the grafana v2 server, initial userid admin password admin.
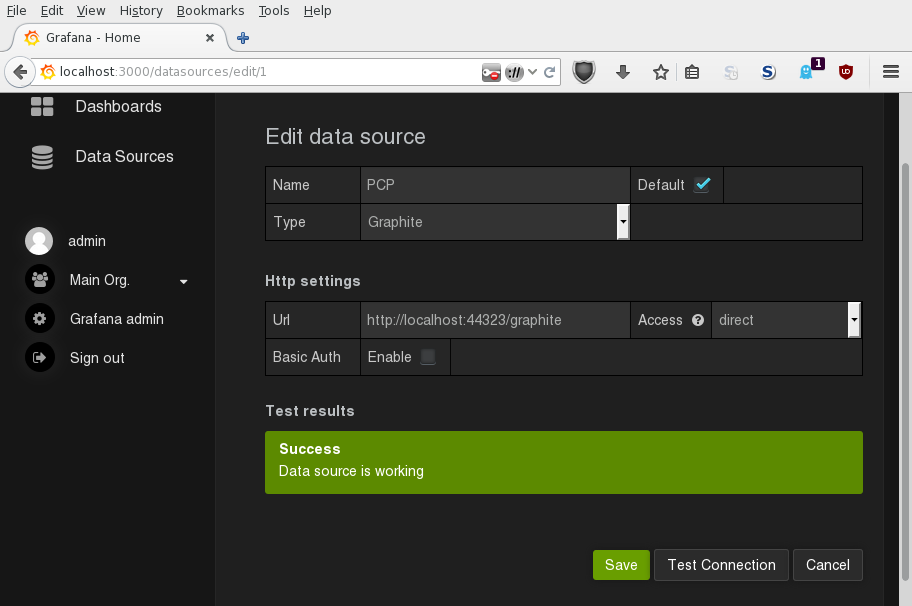
- Observe the empty "Data Sources". Pine for PCP data. Satisfy pining by adding some. (Note carefully the URL. Adjust the pmwebd host name and port number accordingly. No "/" at the end!).

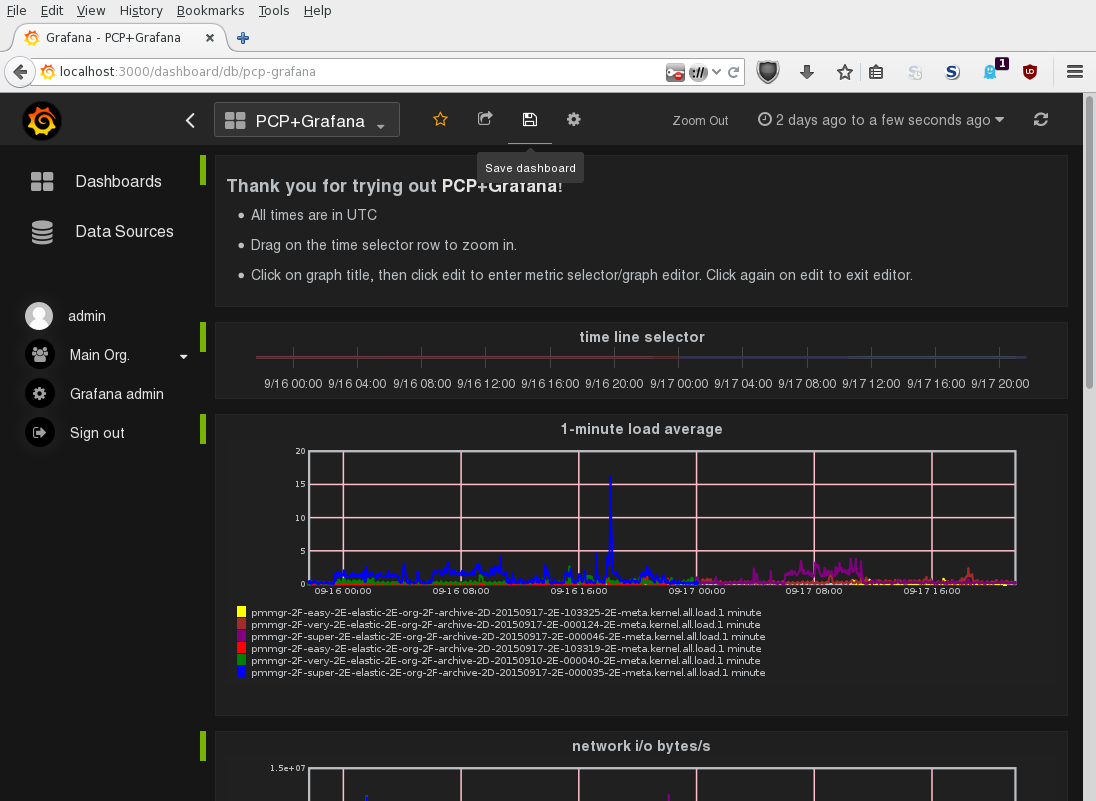
- Observe the empty "Dashboards". Pine for PCP dashboards. Satisfy pining by clicking on "Home". Select "Import". Navigate to pcp grafana v1.9.1 dashboards, such as /usr/share/pcp/webapps/grafana/app/dashboards/default-png.json .
- Observe a happy working grafana v1.9.1 dashboard working in v2. Save it to grafana v2's server.

- Play around with grafana v2. Let us know how you like it working with pcp.
- ...
- PROFIT!
Disclaimer: results not guaranteed.


